Solar Information
Solar images from SOHO
The Sun Now

Extreme ultraviolet Imaging Telescope image at 284 Angstrom (to 2 million degrees K)

Michelson Doppler Imager (MDI) image showing sunspots

Magnetogram image showing magnetic field, black and white show opposite polarities
Information from the Space Weather Prediction Center, Boulder, CO
National Oceanic and Atmospheric Administration (NOAA)
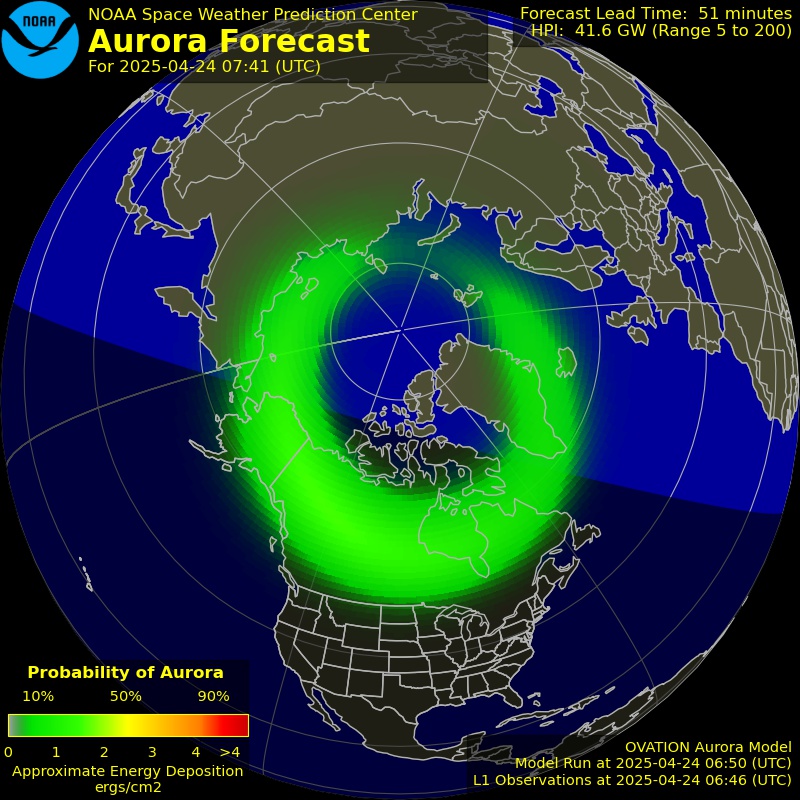
Aurora Activity
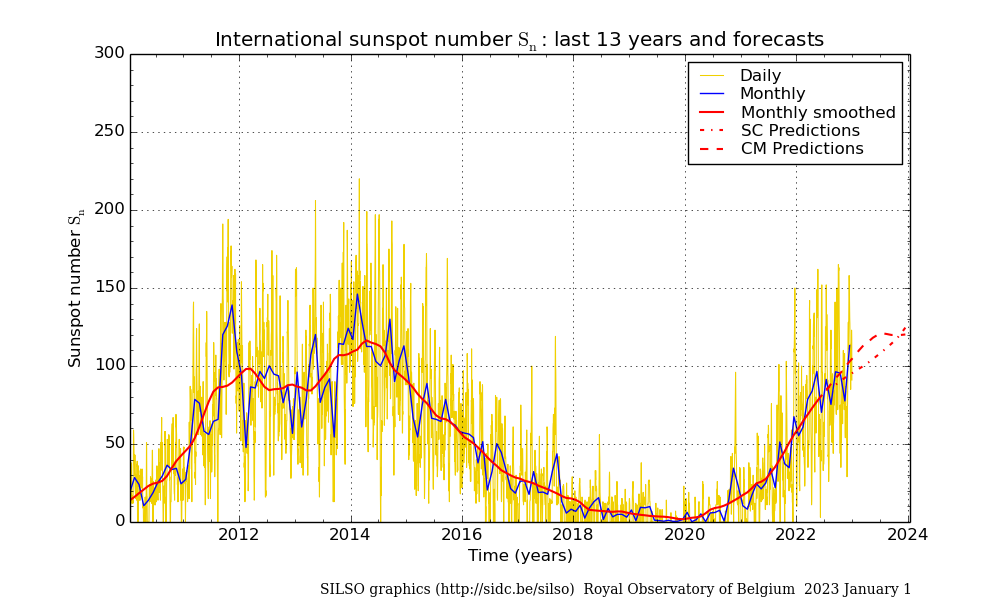
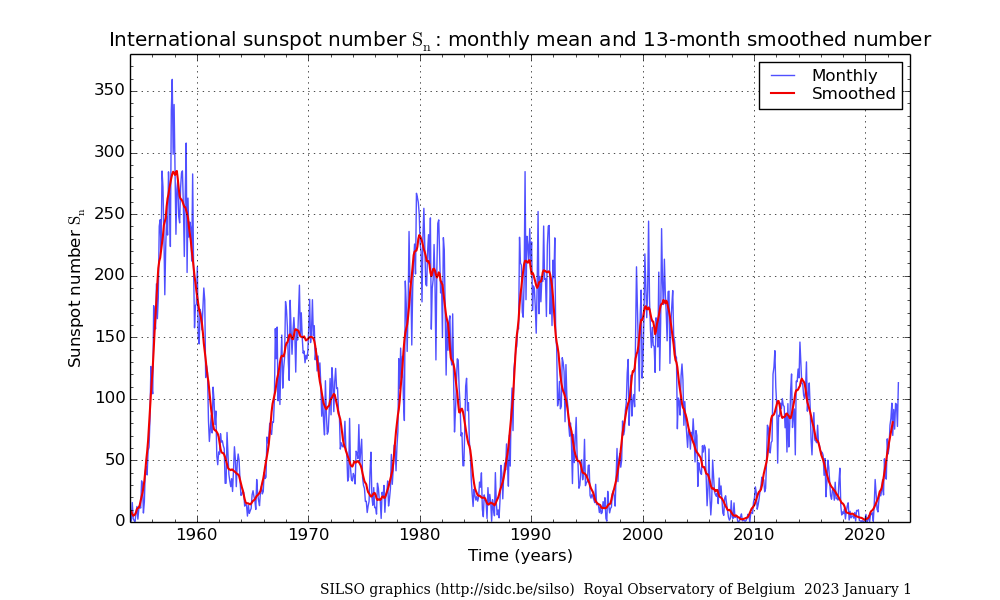
Solar Cycle
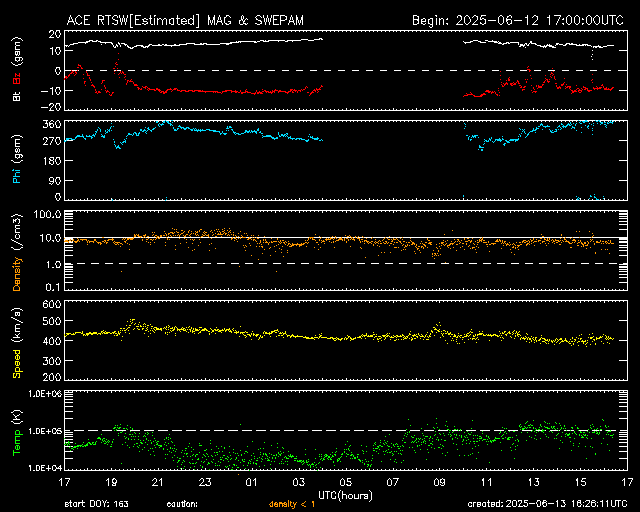
Solar Wind
3-day Solar-Geophysical Forecast
:Product: 3-Day Forecast
:Issued: 2026 Feb 22 1230 UTC
# Prepared by the U.S. Dept. of Commerce, NOAA, Space Weather Prediction Center
#
A. NOAA Geomagnetic Activity Observation and Forecast

The greatest observed 3 hr Kp over the past 24 hours was 5 (NOAA Scale
G1).
The greatest expected 3 hr Kp for Feb 22-Feb 24 2026 is 5.33 (NOAA Scale
G1).

NOAA Kp index breakdown Feb 22-Feb 24 2026

             Feb 22       Feb 23       Feb 24
00-03UT       4.00         3.67         3.67
03-06UT       5.00 (G1)    4.67 (G1)    3.67
06-09UT       5.33 (G1)    3.67         2.67
09-12UT       4.00         3.67         2.67
12-15UT       2.67         2.67         2.00
15-18UT       2.67         2.67         1.67
18-21UT       3.67         2.67         1.67
21-00UT       3.67         3.67         2.67

Rationale: The geomagnetic field is expected to reach G1/G2
(Minor/Moderate) storm levels on 22 Feb, followed by likely G1 storming
conditions on 23 Feb, due to CIR effects and negative polarity CH HSS
influences.

B. NOAA Solar Radiation Activity Observation and Forecast

Solar radiation, as observed by NOAA GOES-18 over the past 24 hours, was
below S-scale storm level thresholds.

Solar Radiation Storm Forecast for Feb 22-Feb 24 2026

              Feb 22  Feb 23  Feb 24
S1 or greater    1%      1%      1%

Rationale: No S1 (Minor) or greater solar radiation storms are expected.
No significant active region activity favorable for radiation storm
production is forecast.

C. NOAA Radio Blackout Activity and Forecast

No radio blackouts were observed over the past 24 hours.

Radio Blackout Forecast for Feb 22-Feb 24 2026

              Feb 22        Feb 23        Feb 24
R1-R2            5%           10%           10%
R3 or greater    1%            1%            1%

Rationale: There is a slight chance for isolated (R1-R2/Minor-Moderate)
radio blackouts over 23-24 Feb.


